Available for Internships & Collaborations

Peter Tadiwanashe Kawudzu

About Me
Peter Tadiwanashe Kawudzu Available for Opportunities

Peter Tadiwanashe Kawudzu

Harare, Zimbabwe

2nd Year
3+ Projects
100% Dedicated
Download Resume

About Me

Peter Tadiwanashe Kawudzu

I'm Peter

Data Analyst Associate

I am a second-year BSc Honours Applied Statistics student at the University of Zimbabwe, deeply fascinated by the power of data and how numbers, when interpreted correctly, drive impactful decisions.

My academic journey has equipped me with a strong grounding in statistical theory, probability, and quantitative methods — skills I actively apply using Python, R, SPSS/MINITAB, Power BI, and Excel to explore real datasets and extract meaningful insights.

I am currently deepening my expertise in machine learning fundamentals, database querying with SQL, statistical analysis and data visualisation, and I am actively seeking an internship opportunity to apply my statistical knowledge in a professional environment and grow as a data professional.

Skills & Abilities

Analysis & Logic

Python R SPSS Minitab Pandas NumPy
Python Python 85%
Pandas Pandas & NumPy 80%
R R 85%
MINITAB MINITAB 90%

Data Visualisation

Power BI Excel Matplotlib Seaborn
Power BI Power BI 82%
Excel Excel 78%
Matplotlib Matplotlib / Seaborn 75%

Tools & Engineering

Git Jupyter
Git Git & GitHub 40%
Jupyter VS Code / Jupyter 85%

My Education

"Education is the most powerful weapon which you can use to change the world."

2024 — Present
University of Zimbabwe

BSc Honours in Applied Statistics

University of Zimbabwe | UZ

2024 – 2028 | Currently in 2nd Year

Pursuing a rigorous programme covering statistical theory, data modelling, probability, computing, and quantitative research methods.

Key Coursework:

Probability Theory Statistical Inference Regression Analysis & ANOVA Statistical Computing Theory of Estimation & Hypothesis Testing Multivariate Methods Time Series Analysis & Econometrics Survey Techniques & Sampling Theory Design & Analysis of Experiments Industrial Quality Control & Management
2022 — 2023
Lord Malvern High School

Advanced Level (A-Level)

Lord Malvern High School

2022 – 2023 | Completed

Completed A-Level studies with a strong focus on quantitative and analytical subjects that built the foundation for Applied Statistics.

Subjects:

Pure Mathematics Statistics Business Studies Communication Skills

My Certifications

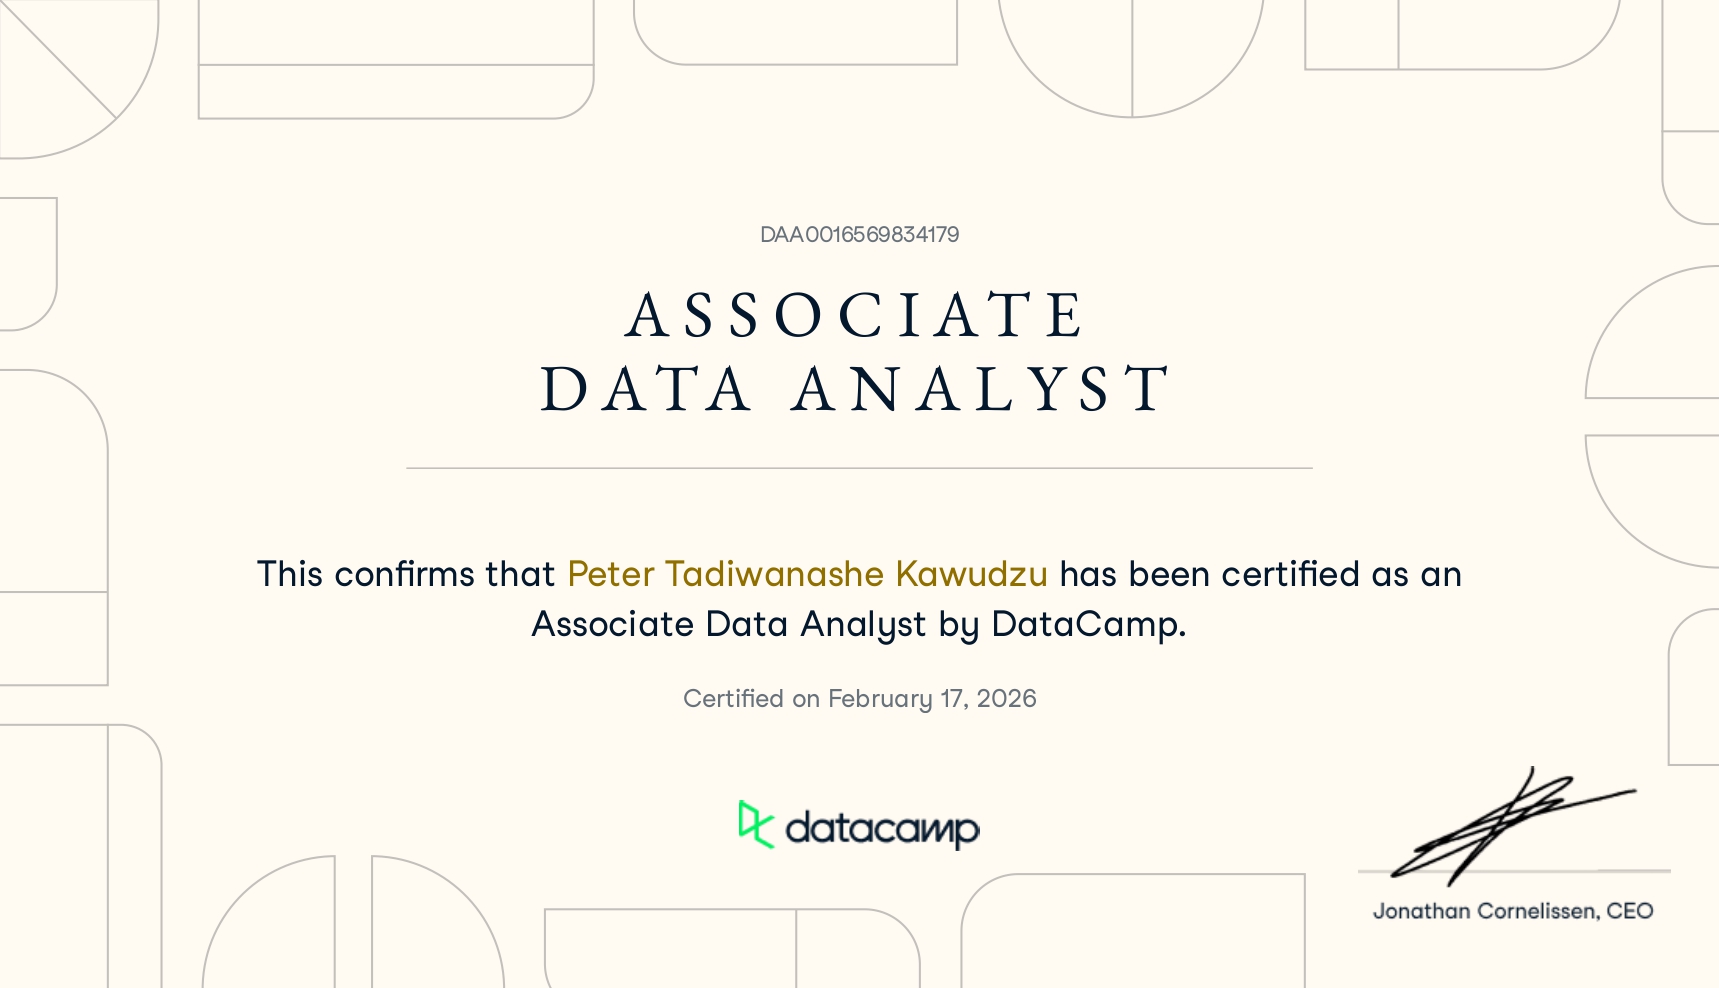
Data Analyst Associate Certification
Associate Data Analyst DataCamp
View Credential
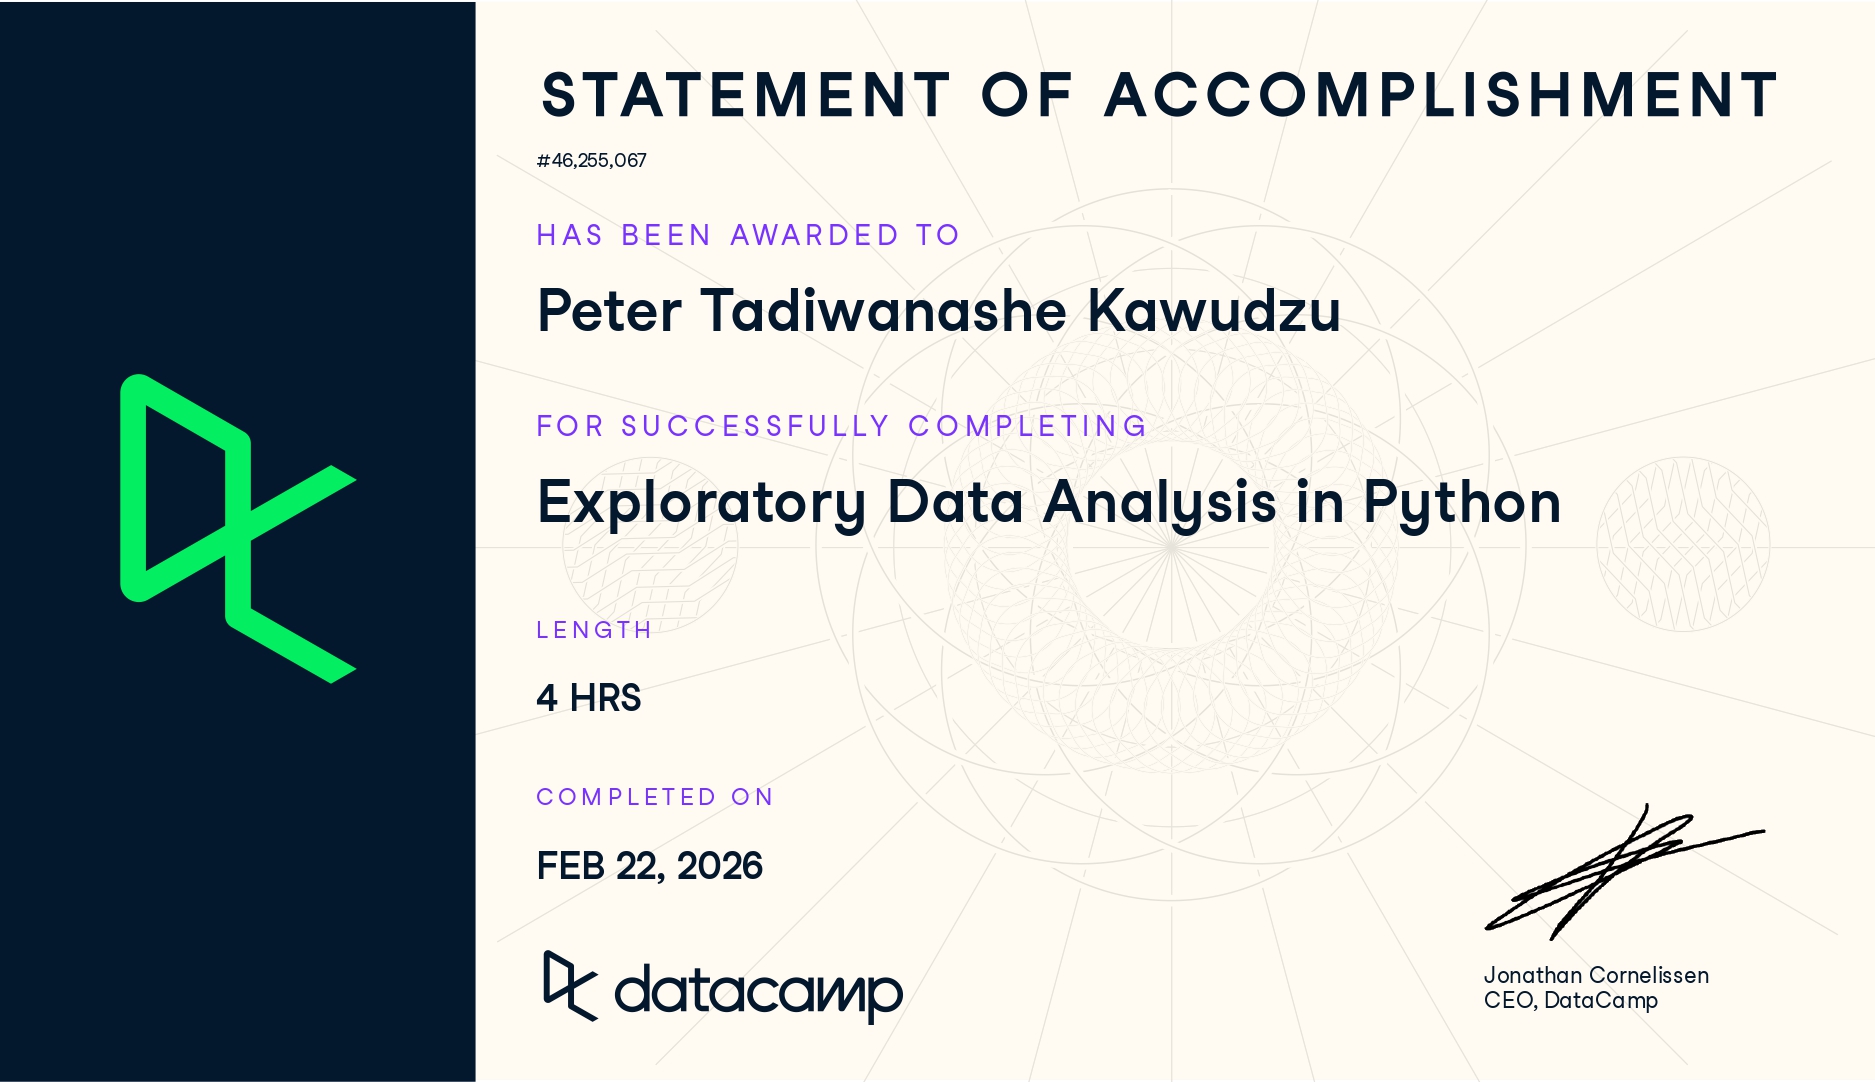
Exploratory Data Analysis in Python Certificate
Exploratory Data Analysis in Python DataCamp
View Credential
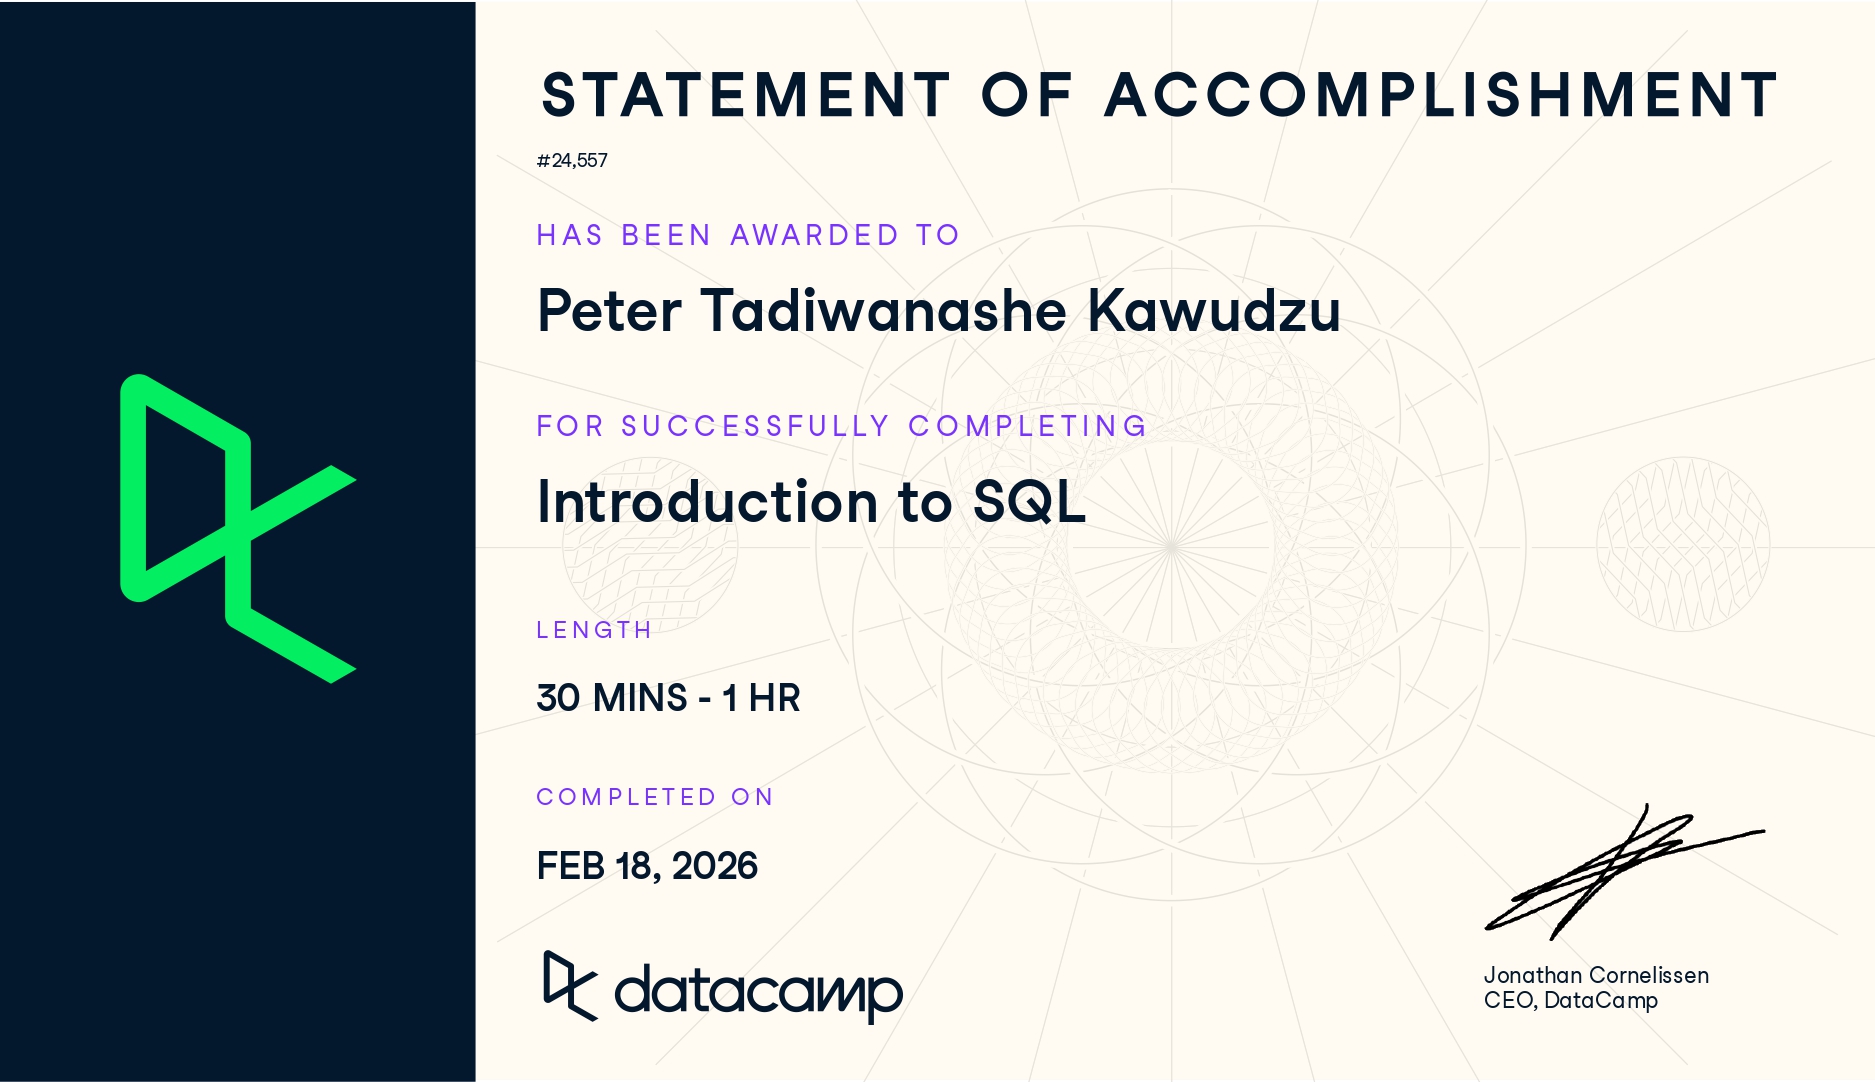
Introduction to SQL Certificate
Introduction to SQL DataCamp
View Credential

End-to-End Projects

Acceptance Sampling OC Curve Analysis

Acceptance Sampling on Manufacturing Production Lots

Problem: 100% inspection of every production lot is too costly and slow, but accepting lots without any inspection risks letting defective batches reach customers.

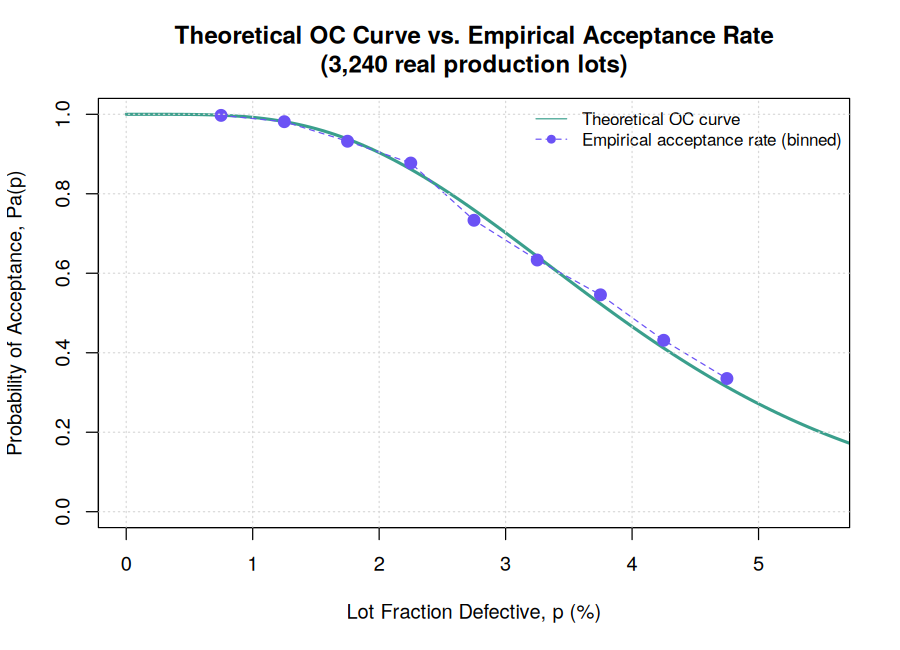
Work: Designed a single sampling plan (n=121, c=4) against AQL=1.5%/LQL=6.5% targets using the binomial distribution, derived its theoretical OC curve, then applied the plan to 3,240 real production lots by drawing actual inspection samples from each lot's true defect rate.

Tools: R (base) · Binomial distribution theory · OC curve analysis

AQL/LQL OC Curve AOQ Producer/Consumer Risk

Outcome: Empirical acceptance rates across 3,240 lots tracked the theoretical OC curve closely, validating the plan; accepted 2,331 lots (71.9%) with a mean Average Outgoing Quality of 1.15% defective.

Statistical Quality Control · University of Zimbabwe · 2026

Inventory Stock-Out Risk Dashboard

Inventory Stock-Out Risk & Reorder Analysis

Problem: A retail network needed to know, for every product at every store, which items were about to stock out and how much to reorder.

Work: Used SQL to compute real demand statistics (mean and standard deviation) from 731 days of daily sales history per store/product, then built a live Excel reorder-point model with statistical safety stock, EOQ, and a risk dashboard.

Tools: SQL (SQLite), Excel

Reorder Point Safety Stock EOQ Demand Variability

Outcome: Flagged 62 of 100 store/product combinations as below their statistical reorder point, surfacing $2.3M in suggested reorder value and pinpointing which categories and stores needed attention most.

Private
Sales Analytics Dashboard

Sales Analytics Dashboard

Problem: Leadership lacked a single up-to-date view of sales performance, forcing manual cross-checking across multiple spreadsheets to answer basic questions like which regions or products were underperforming.

Work: Consolidated raw sales data into a clean model and built an interactive Power BI dashboard with drill-downs by region, product category, and time period, including KPI cards for revenue, growth, and target attainment.

Tools: Power BI, Excel, DAX

Outcome: Gave stakeholders a self-service view of sales performance, cutting the time spent answering ad-hoc reporting requests and surfacing underperforming segments earlier.

Source code is private — available upon request
VECM Volatility Modeling

Financial Econometrics — VECM Volatility Modeling

Problem: Multiple financial time series exhibit non-stationarity and potential long-run equilibrium relationships — naive regression on such series produces spurious results, requiring cointegration and equilibrium modeling techniques.

Work: Built a rigorous 7-D analytical handbook applying ADF & KPSS unit-root tests, Johansen cointegration, and a Vector Error Correction Model (VECM) to 10 years of daily AAPL, MSFT, and GLD prices. Concluded with a live pairs-trading blueprint using ECT Z-score signals.

Tools: Python · statsmodels · yfinance · Pandas · Matplotlib · Seaborn · SciPy

ADF & KPSS Johansen Test VECM ECT Signals Pairs Trading

Outcome: Confirmed one cointegrating vector across AAPL–MSFT–GLD; identified structural breaks during COVID-19 (2020) and the Fed rate-hike cycle (2022); designed a VECM-GARCH extension roadmap for production deployment.

HASTS 211 · University of Zimbabwe · 2026

Let's Connect

Get In Touch

Open to internships, collaborations, and data conversations

Ready to work together?

Feel free to reach out for collaborations, internship opportunities, or just to say hello. I'm always excited to connect with fellow data enthusiasts and professionals!

Email

tadiwapeter04@gmail.com

WhatsApp

+263 774 568 471

University

University of Zimbabwe

Location

Harare, Zimbabwe

Follow Me

Send Message

I'll get back to you as soon as possible

Response time: Within 24 hours